How to plot a dataframe in Pandas
In this post, I will teach you how to plot a dataframe you created in Pandas. (more…)
In this post, I will teach you how to plot a dataframe you created in Pandas. (more…)
Here’s how to calculate skewness in Pandas.
Skewness is a measure of the asymmetry of a distribution. A distribution is said to be skewed if the mean, median, and mode are not all equal.
In Pandas, you can calculate skewness using the skew() method. The skew() method takes a DataFrame or Series as its argument and returns a numeric value.
(more…)
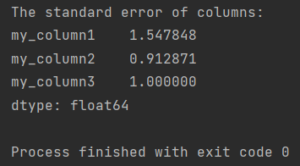
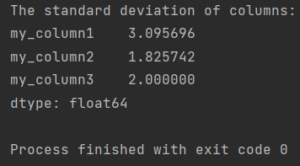
Standard deviation is a measure of how spread out the values in a set are. A low standard deviation indicates that the values are close to the mean, while a high standard deviation indicates that the values are spread out over a wider range.
Here’s how to calculate standard deviation in Pandas.
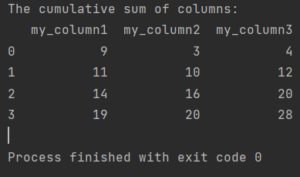
Here’s how to calculate cumulative sum in Pandas.
(more…)
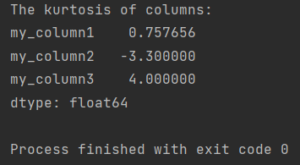
Here’s how to calculate kurtosis in Pandas.
 . (more…)
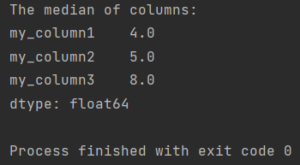
Here’s how to calculate median in Pandas.
 (more…)