Here’s how to calculate cumulative sum in Pandas.
How to calculate cumulative sum in Pandas
To calculate a cumulative sum in Pandas just use a cumsum method which Pandas is offering to you.
import pandas as pd
my_df = pd.DataFrame({"my_column1": [9, 2, 3, 5],
"my_column2": [3, 7, 6, 4],
"my_column3": [4, 8, 8, 8]})
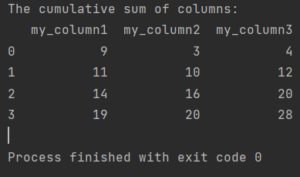
print(f'The cumulative sum of columns:\n{my_df.cumsum()}')
The cumulative sum of columns:
   my_column1  my_column2  my_column3
0           9           3           4
1          11          10          12
2          14          16          20
3          19          20          28
How to calculate cumulative sum in Pandas by group
Sometimes you may want to calculate a cumulative sum in Pandas not for the whole dataframe, but for each group of values in a column. For example, if you have a column that indicates the category of each row, you may want to see how the cumulative sum changes within each category.
To do this, you can use the groupby method to group the dataframe by the column of interest, and then apply the cumsum method to each group. This will return a new dataframe with the same shape as the original one, but with the cumulative sum calculated for each group.
For example, let’s say we have a dataframe that contains the sales data of different products in different regions. We want to calculate the cumulative sum of sales for each product in each region.
import pandas as pd

sales_df = pd.DataFrame({"product": ["A", "A", "A", "B", "B", "B", "C", "C", "C"],
                         "region": ["X", "Y", "Z", "X", "Y", "Z", "X", "Y", "Z"],
                         "sales": [10, 20, 30, 40, 50, 60, 70, 80, 90]})

print(f'The sales dataframe:\n{sales_df}')
To calculate the cumulative sum of sales by product and region, we can use:
cumsum_df = sales_df.groupby(["product", "region"]).cumsum()

print(f'The cumulative sum dataframe:\n{cumsum_df}')
The cumsum_df dataframe has the same shape and index as the sales_df dataframe, but the sales column shows the cumulative sum of sales for each product in each region. For example, the value of sales for product A in region X is 10, which is the same as the original value. The value of sales for product A in region Y is 20, which is the sum of 10 and 10. The value of sales for product A in region Z is 30, which is the sum of 10, 10 and 10. And so on.
You can also use other aggregation functions besides cumsum, such as cumprod (cumulative product), cummin (cumulative minimum), cummax (cumulative maximum), etc.
For more details see the documentation of cumsum function.
Pingback: How To Count Number Of Duplicates • Pandas How To
Pingback: How To Calculate Sum Of Rows And Columns In Pandas • Pandas How To
Pingback: How To Calculate Business Days In Pandas • Pandas How To
Pingback: How To Sum A Column • Pandas How To
Pingback: How To Calculate Ratio In Pandas • Pandas How To