Here’s how to calculate kurtosis in Pandas.
 .
.
How to calculate kurtosis in Pandas
To calculate a Kurtosis in Pandas just use a Kurt method which Pandas is offering to you.
import pandas as pd
my_df = pd.DataFrame({"my_column1": ['9', '2', '3', '5'],
"my_column2": ['3', '7', '6', '4'],
"my_column3": ['4', '8', '8', '8']})
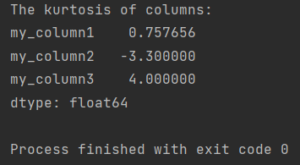
print(f'The kurtosis of columns:\n{my_df.kurtosis()}')
The kurtosis of columns:
my_column1    0.757656
my_column2   -3.300000
my_column3    4.000000
dtype: float64
The kurtosis method calculates the excess kurtosis, which is the kurtosis of a dataset minus the kurtosis of a normal distribution. A positive value of kurtosis indicates that the data has heavier tails than a normal distribution, while a negative value indicates lighter tails.
How to interpret kurtosis in Pandas
Now that we know how to calculate kurtosis in Pandas, we might wonder what it means and how to use it. Kurtosis is a measure of how peaked or flat a distribution is compared to a normal distribution. A normal distribution has a kurtosis of zero, meaning that it has the same shape as the standard bell curve.
A high kurtosis (>0) means that the distribution has a sharper peak and fatter tails than a normal distribution. This implies that there are more outliers or extreme values in the data. A low kurtosis (<0) means that the distribution has a flatter peak and thinner tails than a normal distribution. This implies that there are fewer outliers or extreme values in the data.
Kurtosis can be useful for detecting anomalies or outliers in the data, as well as for assessing the suitability of certain statistical models or tests. For example, some parametric tests assume that the data follows a normal distribution, and a high or low kurtosis can indicate a violation of this assumption. On the other hand, some non-parametric tests do not require any assumptions about the distribution of the data, and can be applied regardless of the kurtosis.
However, kurtosis alone is not enough to describe the shape of a distribution, as different distributions can have the same kurtosis but different skewness or variance. Skewness is a measure of how symmetric or asymmetric a distribution is, while variance is a measure of how spread out or dispersed a distribution is. Therefore, it is advisable to use kurtosis in conjunction with other descriptive statistics, such as mean, median, mode, standard deviation, range, interquartile range, and boxplots.
In summary, kurtosis is a useful statistic for measuring how peaked or flat a distribution is compared to a normal distribution. It can help us identify outliers or extreme values in the data, as well as evaluate the appropriateness of certain statistical methods or tests. However, kurtosis should not be used in isolation, but rather as part of a comprehensive exploratory data analysis.
For more details see the documentation of kurt function.
Pingback: How To Calculate Median In Pandas • Pandas How To