Standard deviation is a measure of how spread out the values in a set are. A low standard deviation indicates that the values are close to the mean, while a high standard deviation indicates that the values are spread out over a wider range.
Here’s how to calculate standard deviation in Pandas.
How to calculate standard deviation in Pandas
In Pandas, you can calculate the standard deviation of a column using the std() method. The std() method takes a single argument, which is the name of the column.
For example, the following code calculates the standard deviation of the my_column1 column in the my_df DataFrame:
import pandas as pd
my_df = pd.DataFrame({"my_column1": [9, 2, 3, 5],
"my_column2": [3, 7, 6, 4],
"my_column3": [4, 8, 8, 8]})
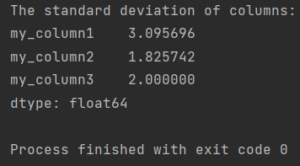
print(f'The standard deviation of columns:\n{my_df.std()}')
This code outputs the following:
The standard deviation of columns:
my_column1    3.095696
my_column2    1.825742
my_column3    2.000000
dtype: float64
By default, the std() method calculates the sample standard deviation. This means that the standard deviation is calculated using the sum of squared deviations from the mean, divided by the number of values minus 1.
If you want to calculate the population standard deviation, you can set the ddof parameter to 0. The ddof parameter stands for “degrees of freedom”, and it is used to adjust the standard deviation calculation to account for the fact that we are estimating the population standard deviation from a sample.
For example, the following code calculates the population standard deviation of the my_column1 column in the my_df DataFrame:
standard_deviation = my_df['column_name'].std(ddof=0)
The std() method can also be used to calculate the standard deviation of multiple columns. To do this, you can pass a list of column names to the std() method.
For example, the following code calculates the standard deviation of the my_column1 and my_column2 columns in the my_df DataFrame:
statistics = my_df['column_name'].describe()
standard_deviation = statistics['std']
The std() method is a versatile tool that can be used to calculate the standard deviation of one or multiple columns in a Pandas DataFrame.
Using the describe() Method
In addition to the std() method, you can also use the describe() method to calculate the standard deviation of a column. The describe() method returns a DataFrame that contains summary statistics for the values in the column, including the mean, standard deviation, minimum, maximum, and quartiles.
For example, the following code calculates the standard deviation of the my_column1 column in the my_df DataFrame using the describe() method:
statistics = my_df["my_column1"].describe()

standard_deviation = statistics["std"]
The describe() method is a more versatile tool than the std() method, as it can be used to calculate summary statistics for multiple columns. However, the std() method is more efficient, as it only calculates the standard deviation of a single column.
For more details see the documentation of std function.
Pingback: How To Calculate Median In Pandas • Pandas How To
Pingback: How To Calculate Beta • Pandas How To
Pingback: How To Calculate Z Score In Pandas • Pandas How To