In this tutorial, you learn how to plot a histogram in Pandas.
Histogram in Pandas
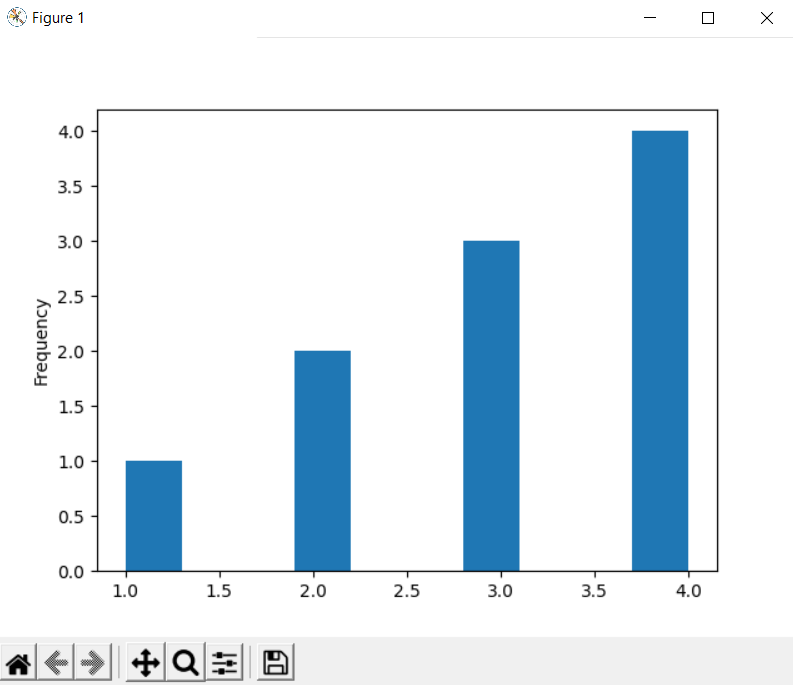
To plot a histogram in pandas, use the plot method on a pandas DataFrame or Series, and set kind to ‘hist’:
import pandas as pd
import matplotlib.pyplot as plt

data = [1, 2, 2, 3, 3, 3, 4, 4, 4, 4]

df = pd.DataFrame(data, columns=['value'])
df['value'].plot(kind='hist')
plt.show()
You can also customize the histogram using optional parameters, such as bins to set the number of bins, and rwidth to set the bar width.